

Excess Mortality is rampant but not for those in charge. Part 1 of 3
Part I: Is Canada alone?

“Correlation doesn’t imply causation, but it does waggle its eyebrows suggestively and gesture furtively while mouthing ‘look over there’.” -- Randall Munroe
On November 27 2023 Statistics Canada finally released information on deaths in 2022 (causes of death, overall life expectancy, etc.) which should have moved emotionally (one way or another) every Canadian regardless of political affiliation and views on the state of the healthcare and mass media in the country. The unusually delayed statistics are summarized in a report which conveniently puts 2022 alongside with the previous 3 years, a seemingly deliberate perspective that makes the data look even more insidious.
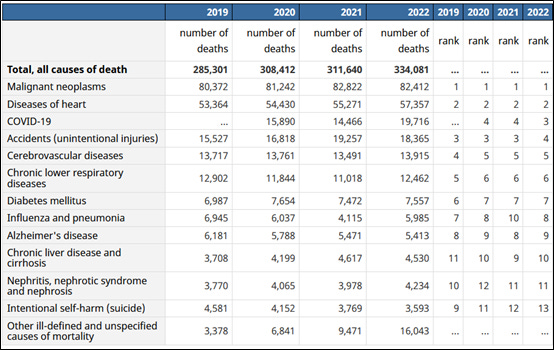
One does not have to be a doctor, a scientist, or a statistician to be stunned by some of those numbers. The most obvious eyesore is on the fourth line labelled “COVID-19”, where deaths were at an all-time high in 2022 – a remarkable 24 percent increase from 2020.
Those who take “COVID-19 deaths” statistics seriously should be outraged by the sheer audacity of just throwing this number in public’s face with no adequate explanation and total media silence. Remember, the same COVID death toll was used to drive the media hype, masking, lockdowns and other draconian measures in 2020-21. The year 2022 saw the end of those measures followed by declaring a glorious victory over the pandemic, and yet the deaths then were even higher. If those measures, including mass vaccination worked, then why increase in Covid deaths? And if the virus took significantly more lives in 2022 than in 2020/21, where were those images of hospital corridors overflowing with catatonic patients, desperate relatives screaming for news, military trucks carting bodies off to mass graves or crematoria or who knows where? Instead, what we see is our fearless healthcare officials celebrating the victory over pandemic and contemplating how tolling the “years of pandemic” were on them.
The only reasonable explanation to this paradox is that “COVID-19 death” is a meaningless term coined by a redefined death certification process and bogus testing that artificially inflated Covid death statistics (more on that in this essay). In the US, those deaths in the official documents are now carefully called “COVID-19 associated” with a side explainer as “Deaths of persons coded to International Classification of Diseases, Tenth Revision (code U07.1), with COVID-19 as an underlying or contributing cause of death” (emphasis added).
And those, who don’t take the COVID deaths numbers seriously and just received the affirmation of that by the official Canadian government statistics agency, should be even more outraged by the lack of honesty and consistency of our public health bureaucrats, media, and politicians who put in place those restrictions that at the very least contributed to (if not became the main reason for) the rise in deaths during those years.
But putting the ambiguous topic of the “COVID deaths” aside, another line on the aforementioned report should be even more concerning – the number of total deaths, which was on a steep rise in 2021-2022, and, unlike COVID-19 deaths, showed no signs of waning in 2023 and is on the same (or perhaps even worse) track according to the preliminary 2024 mortality statistics.
In 2020 and 2021 the COVID-19 associated deaths remained pretty much at the same circa 15,000 count, and while there was that alarming and embarrassing 4,000 increase in 2022 to almost 20,000 “Covid associated”, that number is quite inadequate to explain 50,000 total deaths that took place in 2022 over and above the pre-pandemic 2019 number. We are talking about 30,000 deaths on top of 20,000 attributed to Covid!
It must be said that in 2020 and 2021, public health officials and politicians, among other things like COVID deaths, cited the rate of excess deaths as justification for implementing draconian restrictions and suspending civil liberties. In 2022, however, the extraordinary rise in excess mortality (not associated with but significantly higher than that of COVID), has been ignored.
If Canadians were reminded every day from every corner about the disease that allegedly kills 15,000 people in a year, why aren’t they hearing anything about something (or some things) that is killing twice as many NOW?
Excess deaths or excess mortality is a very important measure, which, when it goes out of bounds of mere statistical noise, points to the presence of a significant event or circumstances causing either better health and longevity (negative excess mortality) or more people to die (positive excess mortality).
Excess mortality is the difference (in percentages) between the observed number of deaths and the expected number of deaths based on past experience (baseline), which is commonly calculated as an average across the previous 5 years. Different institutions use different methods for measuring excess mortality and its baseline, and include various adjustments to account for dynamics in demography (i.e. age and sex) as well as significant events (i.e. wars and natural disasters).
For example, if you look at the historical excess mortality graph for Afghanistan, after all the negative orange bars signifying improvement in Afghani’s lives, the 1979 – 1985 period is totally different and crying out for an explanation. And the explanation for such an eyesore is the rebellion in 1979 followed by Soviet occupation developing into 6 years of guerrilla’s war with casualties marking 1980 with 3.4 percent of excess mortality and reaching over 20 percent in 1984. After that turmoil the graph takes a deep dive into the negative zone indicating things going back to normal.

Source of data: Our World in Data (OWID) Births and Deaths, Population Growth, OECD , country-specific official government statistics
Source of the graph: World Excess Mortality P-score History by Country (author’s).
Also, when assessing the impact of specific events, it is helpful to measure mortality during those events against the previous uneventful or normal years. So, the so-called “pandemic years” (2020 onward) are juxtaposed with the pre-pandemic average mortality of 2015 – 2019 as a baseline. And according to Organisation for Economic Co-operation and Development (OECD) data, in Canada, excess deaths were 9.5 percent in 2020, 15 percent in 2021, and 23 percent in 2022 when compared to that pre-pandemic baseline.
Is that a lot? And how do those numbers compare with other countries? Before jumping to any conclusions by merely comparing the aforementioned Afghanistan’s 21 percent mortality in the early 80’s with Canada’s recent 23 percent, let’s put Canada and Afghanistan on the same playing field first. It is unsound to compare different countries with different birth and mortality rates, and different exposures to calamities like wars and natural disasters without the use of normalizing statistical techniques.
EuroMOMO (European mortality monitoring activity) uses “z-score” statistical tool as one of such techniques to rank and compare excess mortality across a host of European countries. In simple words, and in the context at hand, z-score ranks how much mortality of a country deviates from its historical normal, whatever that normal is for that particular country, thus allowing to compare countries on “apples to apples” basis.

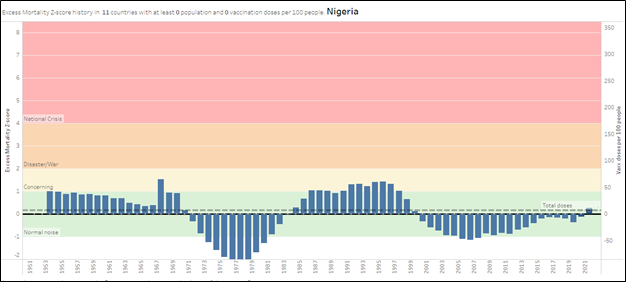
World Excess Mortality z-score history graphs exploit EuroMOMO’s idea by putting it in a wide 70 years historical context and by calibrating z-score ranking against the known calamities that took place in different countries since 1950.
Here’s how the Afghanistan’s 70 years of excess mortality profile looks in the z-score normalized graph:

In the picture above the Afghani’s unrest escalates through the “concerning” yellowish area (1 to 2 z-score) into the “disaster/war” orange zone reaching its pinnacle in 1984 at z-score of 3. And as earlier with percentages, the hump of a war is impossible to miss visually in the graph.
Feel free to browse through various country’s mortality z-score profiles and see if you can spot some of the most infamous country-wide catastrophes of the last 70 years like Khmer Rouge regime in Cambodia (1975-1979) killing 1.7 to 2.2 million or around 25% of the population in 5 years; or Rwandan Genocide (1994) that had 800,000 people murdered, constituting about 10% of Rwanda's population; or Bangladesh Liberation War (1971) where the death toll scaled up to 3 million, affecting around 3% of the population; or Great Chinese Famine (1959-1961) with estimated 15 to 45 million deaths impacting 5-15% of China's population; or Vietnam War (1955-1975) with 3 to 4 million Vietnamese casualties representing 3-4% of the population and having “Tet Offensive” of 1968 clearly sticking out like a tombstone; or Bosnian War (1992-1995) that took about 100,000 lives affecting 2% of Bosnia and Herzegovina's population; or Indonesian anti-communist purge (1965-1966) estimated at 500,000 to 1 million deaths or around 0.5-1% of Indonesians; or Haiti earthquake (2010) counting over 230,000 deaths equating to 2.2% of Haiti's population; or Armenian “Spitak” earthquake (1988) with about 40,000 dead; or even Russia’s Perestroika of the 1990’s which might be associated with positive changes for many people but actually did cause a lot of grief and premature deaths.
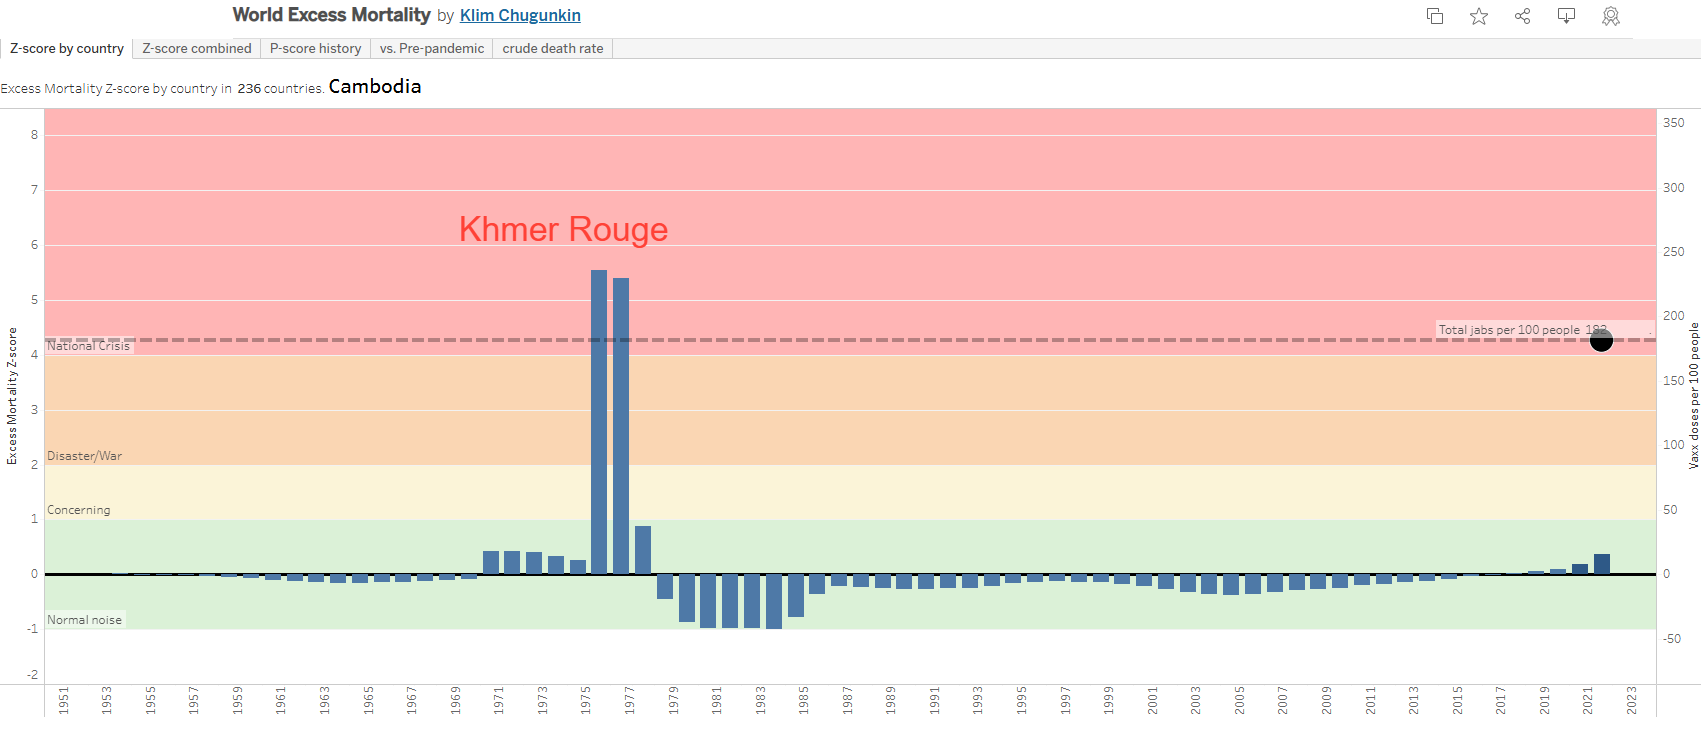
Notice also the black circles and the black dotted horizontal line that describe the levels of Covid vaccinations and total doses administered per 100 people. We will get back to this later.
And now with those images fresh and vivid, let’s finally go back to Canada with the questions asked earlier, if the reported excess mortality in the last years can be considered high, and how it compares with the other countries.
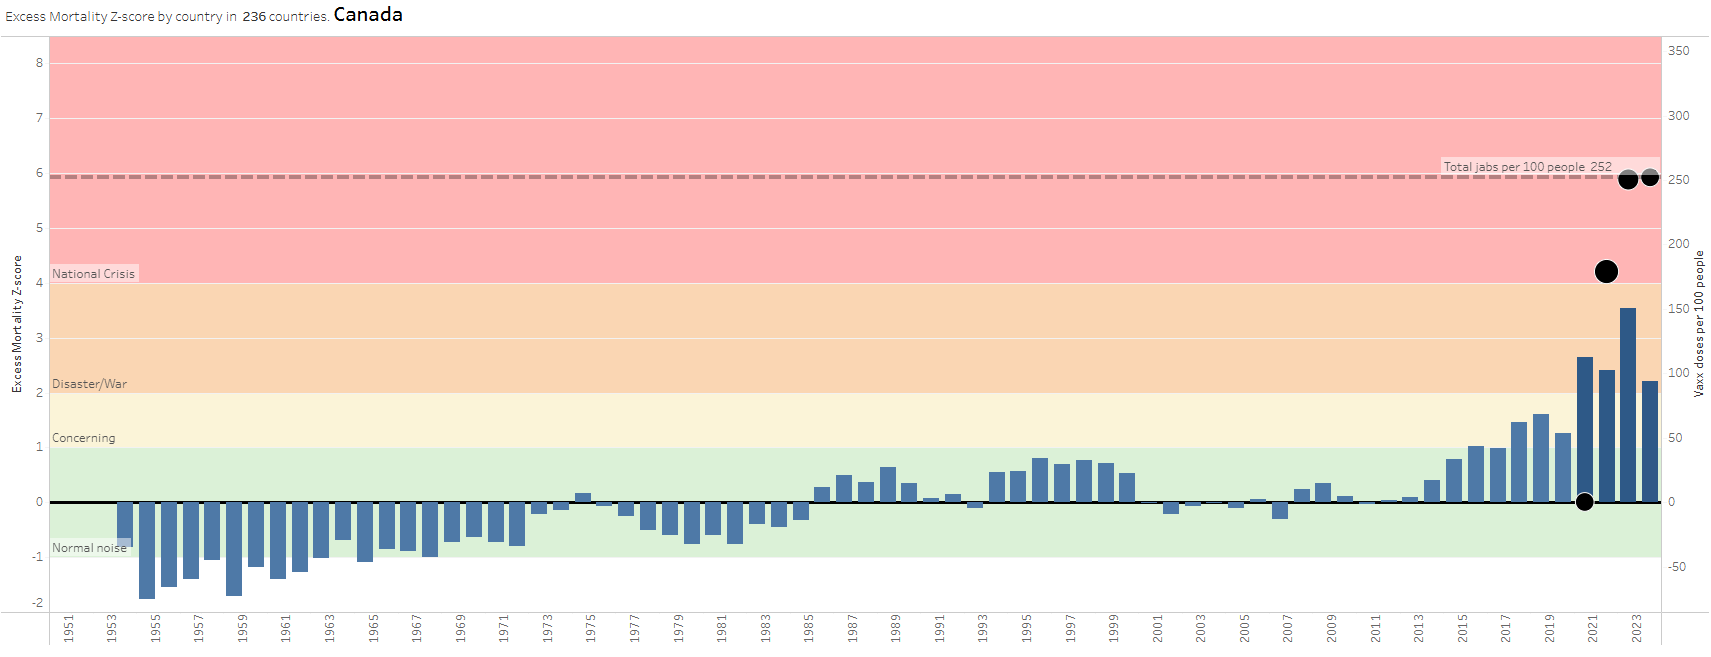
While the pre-pandemic 5 years weren’t exactly stellar mortality-wise and should have set high mortality expectation baseline for the following years (effectively lowering their z-scores), the picture for 2020-2022 still looks quite dismal. Is Canada at a war?
If you think that it certainly looks like that, Canada is by far not alone. Our near and dear neighbour comes across as in much worse shape, which is, unfortunately, not improving, as according to Dr. Pierre Kory, through September of 2023, more than 158,000 Americans have died than over the same period in 2019. That’s more than died in a bunch of wars.

And it’s even worse than that. Deaths should have been well under 2019 rates, since so many sick and elderly people died in 2020-2021 “of Covid” leaving fewer frail folks to die in 2022 and 2023. That means that the current picture is more serious than it looks, and insurance statistics evidence the shocking excess of deaths in the US, especially among working-age people.
Also, if we go back to the previously mentioned wars and disasters, when one is over, the z-score graph takes a deep dive into negative zone. This is because the deadly times set statistical expectations of high mortality, and when things go back to normal and such expectations are no longer met z-score plummets below zero. We do not see that behaviour in 2022 at all and not in 2023 either. And if it seems like the US’s lowered 2022-23 z-score is a sign of developing a good trend, it’s not – it is mostly just an effect of a more pessimistic expectation set by the previous bad years.
When considering the pandemic impact on what mortality looked like in the last 70 years through the proposed z-score lens, the US gets bronze medal after Bolivia and India (although for those two there are no readily available 2022 mortality statistics), whereas Canada, despite its obvious war-like outlook, is only #26 in this race. This means we are in a big family of countries undergoing wartime human casualties.
It must be said at this point that the mortality statistics available at the open sources like Our World in Data (OWID) are not only quite behind with updates but also not easy to process. The “pandemic years” statistics are isolated from other years, thus making historical comparisons like the charts above difficult. It gets worse for trying to link deaths with causes or to obtain age stratified mortality. OWID had a hard stop at 2019 on that for a while and only recently updated its picture up to 2021. Where are all the research institutes and their loyal delivery agents - mainstream media? UN’s World Population data is sitting at 2021 data (at the time of writing this), and it’s 2024 already! OWID’s Excess Mortality dataset is completely missing India and China – the two countries that comprise 40% of the world’s population!
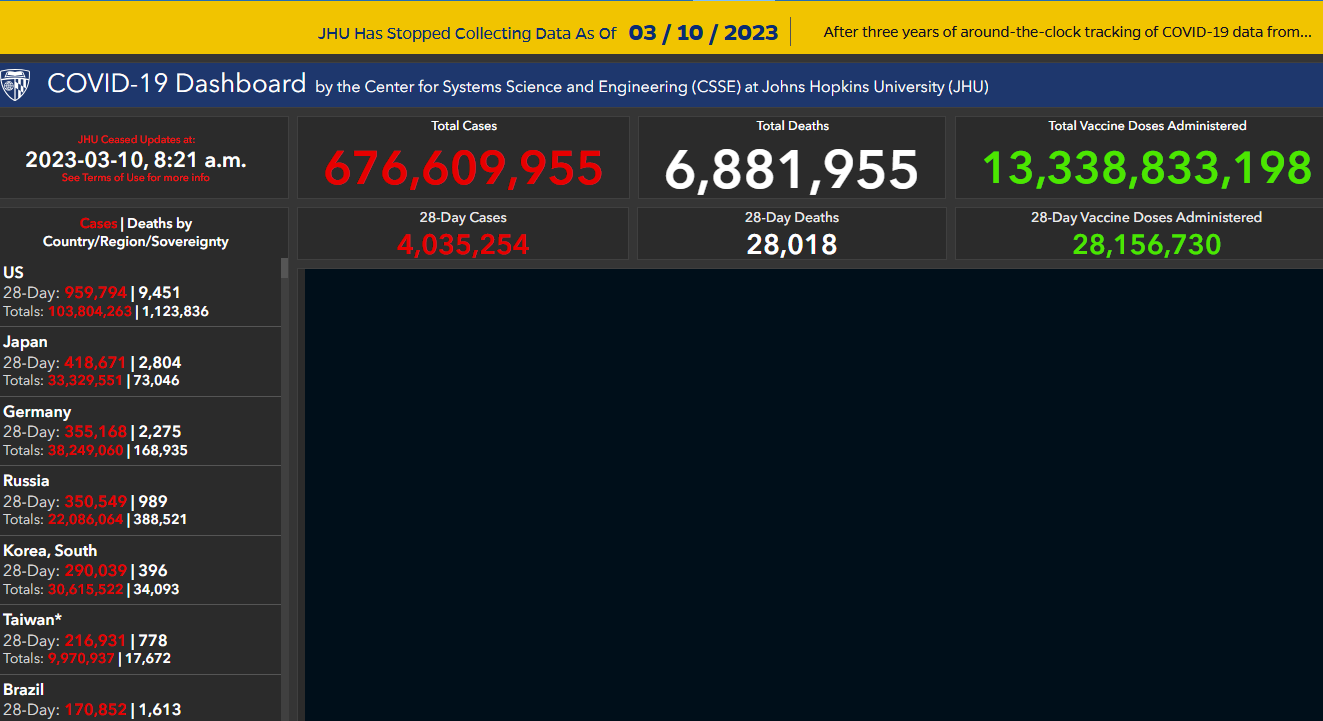
Remember how John Hopkins University (JHU) within weeks of declaring Covid pandemic put together an elaborate ominous red-on-black dashboard tracking not only deaths but hospital/ICU utilization and Covid cases worldwide at state/province level updated daily(!)? Now, when mortality is clearly so much worse in the “developed world”, JHU parked its dashboard at March 2023 and all other establishments working in this field buried their heads in the sand with stale statistics and no analytics.
The author of this essay and the aforementioned historical z-score charts does not pretend to be an expert on the subject at hand and does not claims to offer immaculate and thoroughly validated numbers or the best methods of assessing and comparing mortality statistics. This is just a picture painted with a big brush and perhaps with unorthodox enough perspective that, nevertheless, should deliver the following obvious conclusions to an unsophisticated reader:
Firstly, the excess mortality observed in a lot of countries is extraordinary and can only be compared with a natural disaster or war.
Secondly, the disaster is not caused by the SARS-CoV-2 virus alone – even with all the questionable death attribution, mortality “of Covid” does not come close to what the death count is and there must be something else at play. The phrase “Covid pandemic impact”, so frequently cited by various media outlets and health bureaucrats, should be taken in much broader context than what that phrase suggests.
Thirdly, overwhelmingly, those countries that "managed" COVID the most (and “managed” includes vaccination) achieved and continue with the most devastating war-like damages to their populations.
The third conclusion is reaffirmed by countries that did not participate in the pandemic theatre showing virtually no changes in excess mortality. Feel free to flip through the countries with the lowest vaccination levels (e.g. 20 per 100 people or less) and you won’t find war-like humps or disaster-like spikes in 2021-2022 or even 2020.
The correlation of the vaccination levels with excess mortality is unquestionable. Those countries that jabbed their population the most, however, are also the ones who exercised the most draconian measures “to flatten the curve” ™. So, while it might be tempting to say “vaxx did it”, there are likely other factors at play, like postponed cancer screening (just to mention one), which would inevitably lead to more deaths of “malignant neoplasm” (aka “cancer”). Those affected countries also tend to have older population and probably many other traits worth paying attention to when analyzing the subject at hand.
And of course there are exceptions to that picture among the countries with high vaccination levels as well as among those with low. In the first group, Belgium hit the “national crisis” zone with 4.6 z-score in 2020, but had even slightly negative excess mortality in 2021 - that’s the picture one would expect to see if the pandemic were real and the vaccines worked; Sweden has always been an odd ball exhibiting no mortality anomalies in 2020 – 2022, none whatsoever. And among those with negligible vaccinations (according to the available data), Djibouti and Gabon, nevertheless, show Canada-like mortality profile. It must be noted, that an exception does not disprove a general trend, instead it invites a query as to why that particular country is the exception. If 99 percent of people get murdered in an area, the 1 percent of survivors does not render the area safe.
All of that, and especially the exceptions, should be a gold mine for the research institutes to apply their collective brain powers in solving those dark mysteries (some of which could be as simple as errors in data reporting), enriching the scientific knowledge base and passing their wisdom to journalists to write great essays and to politicians to make sensible policies.
Instead, there is no interest by our research giants in this apparent disaster at all.
US’s CDC only suspects that “….there may be more people who died, either from undiagnosed COVID-19 or from other causes related to the pandemic.” That’s a very keen observation by such a renowned establishment (sarcasm). The part of mere possibility of dying without being tested for Covid (more on that in this essay) seems to be quite a stretch too. “Pandemics and disasters often cause what we call ‘indirect’ deaths. An example of this is when someone dies of a heart attack or stroke because they were afraid to go to the hospital, or if changes in people’s circumstances lead to increases in suicide or drug overdose. We don’t know what’s really happening until we look at the bigger picture.” The offering of that grandeur idea to “look at the bigger picture” in order to resolve the “we don’t know what’s really happening” mystery is pretty much where CDC’s and NIH’s (National Institute of Health) research is completely stuck for now.
The latest information from World Health Organization (WHO) only talks about Covid-19 pandemic associated excess mortality in 2020 and 2021 without defining how exactly the deaths were associated with the pandemic: “…the full death toll associated directly or indirectly with the COVID-19 pandemic (described as “excess mortality”) between 1 January 2020 and 31 December 2021 was approximately 14.9 million (range 13.3 million to 16.6 million)”. Hello! It’s 2024 already! And the primary (if not the only) advice from the world leading health bureaucrat Tedros Adhanom Ghebreyesus (if that’s his real name) is… drum beat… to invest in heath information systems! “These sobering data [full death toll associated directly or indirectly with the COVID-19 pandemic (described as “excess mortality”)] not only point to the impact of the pandemic but also to the need for all countries to invest in more resilient health systems that can sustain essential health services during crises, including stronger health information systems…” Hopefully he only means that we need more JHU-style Covid-19 dashboards or something – not contact tracing or ArriveCAN style scams.
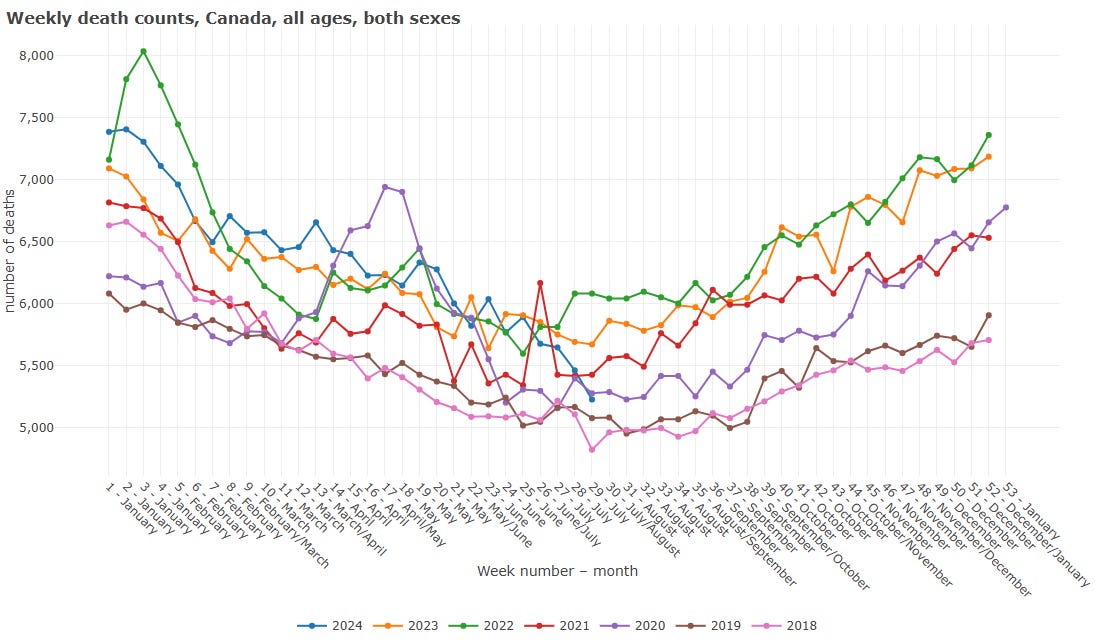
As for the Public Health Agency of Canada (PHAC), there is not a beep on the subject. The only meaningful but still difficult to interpret visual representation of the extremes in the recent excess mortality is published by Statistics Canada. And the information is already archived, meaning, not being updated, has only half of 2023 stats, and is already superseded by much less informative and busy graph. Did the old graph make someone uncomfortable? It should have.
Old (archived at web.archive.org). Note, 2023 only has half a year.

Current (incomprehensibly busy with no reference line):
There is no admission of any possible error on the part of the Canada’s government in regards to the Covid countermeasures or vaccination. On the contrary, they still encourage everyone to get boosters. There are no demands for an inquiry to investigate the situation with excess mortality including the risks of the Covid jabs even by the main opposition parties. There are no investigative journalists trying to get to the bottom of one of the biggest medical scandals in Canadian history, and that stands in obnoxious contrast with the 2020-21 fear porn.
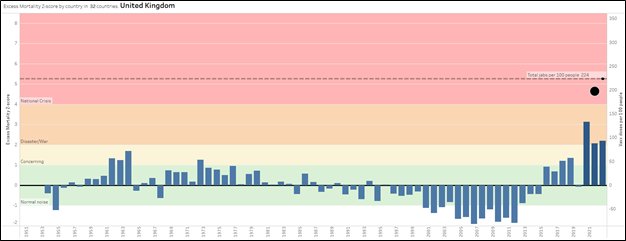
While Canada remains hopeless on the subject, there are glimpses of official interest in the country we shared a King with. But those glimpses of interest are beginning to look clownish and perhaps even worse than Canada’s dead silence (pun is intended). The UK has an ongoing phased Covid-19 public inquiry which started in June 2023. The 4th phase meant to investigating vaccines and therapeutics was originally scheduled to begin in the Summer of 2024, but that has been recently postponed to occur “after the general election” which has to take place before 28 January 2025.
The investigation into vaccines was meant to look in detail at the rollout of the jabs across the UK as well as cover concerns around vaccine safety, including any suggested links between the vaccines and heart issues, and whether reforms are needed to the scheme to pay out for health damage after taking the jabs.
It took about eleven months to (allegedly) develop, test, and approve Covid-19 vaccines. When there is a will, there is a way. It is taking longer than that to even begin the UK Covid vaccine investigation as those who want to remain in power want to postpone that effort for as long as possible and, most importantly for them, until after the next election.
United Kingdom media seems to be in general more alert and transparent about excess deaths than Canada. You won’t find titles like BBC’s ”Excess deaths in 2022 among worst in 50 years” coming from CBC, even though statistically UK’s “pandemic impact” excess mortality looks less disturbing than Canada’s.
But even under the scary looking title lies BBC’s incongruous mumbling about “lasting effects of pandemic”, attribution to Covid itself (of course) and “the crisis in healthcare”. The well-established heart issues caused by Covid vaccines (just to name one) get hand-waived as minor and for kids only (who cares about the kids anyway) under the bold assertion of “No evidence of vaccine effect” – a good old argument from ignorance that firmly rooted itself in the mainstream media when it comes to the subject of vaccine-induced injuries.
Getting back to the Canada Statistics report, last but not least, there is another oddity that stands out and is very confusing: “Other Ill-defined and unspecified causes of mortality”. According to the report, this category has been growing rapidly through 2020 - 2022 and increased 5-fold compared to 2019 number reaching 16,043 deaths. That number ranks the “Other ill-defined” #5 mortality cause in 2022, even though the report does not rank that line at all.
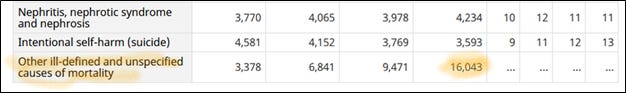
The description might give an impression that this is just a relic of delayed processing of the data, which results in higher number for the most recent years, and as the information gets categorized and adjusted the “ill-defined” number will eventually go down to a reasonable level. Indeed, that would also explain why the source table for the report in question (Table 13-10-0394-01 Leading causes of death, total population, by age group) has no mentioning of the “ill-defined” category at all, even though it goes through top 50 causes of mortality – not just 10-13 as in the aforementioned summary report.
A simple math, however, shows that the 16,043 “ill-defined” deaths are still part of 78,354 “Other causes of death" big category enumerated as just one line in that Table.

It is very confusing why that particular category of “ill-defined” deaths was washed up to the Top 10 summary report level, but is invisible in its underlying table. But that mysterious category is unearthed with more details in Table 13-10-0155-01 Deaths, by cause, Chapter XVIII: Symptoms, signs and abnormal clinical and laboratory findings, not elsewhere classified (R00 to R99).
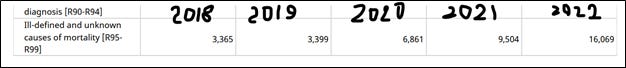
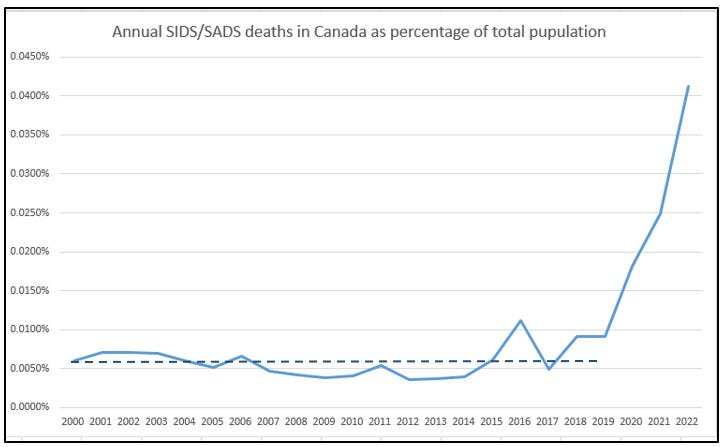
And that’s where things get really interesting! R95-R99 code label sheds more light on this “ill-defined” cause. According to World Health Organisation (WHO) International Classification of Diseases (ICD-10), R95-R99 range of codes is designated for SIDS (sudden infant death syndrome), SADS (sudden adult death syndrome) and unattended/unknown deaths. Statistics Canada does not break down this range further for public eyes, but it would be reasonable to assume that unattended deaths contribute very little to that category, thus leaving SIDS/SADS as major culprits of that “ill-defined and unknown” causes category.
Even with anomalous 2016 and not very happy 2018 and 2019 years, the average annual rate of SIDS/SADS deaths in 2000 through 2019 was around 0.006% of the total population. 2022 exhibits 6-fold increase from that level (3-fold and 4-fold increase in 2020 and 2021 respectively), even visually above and beyond any statistical noise or any known past precedent.
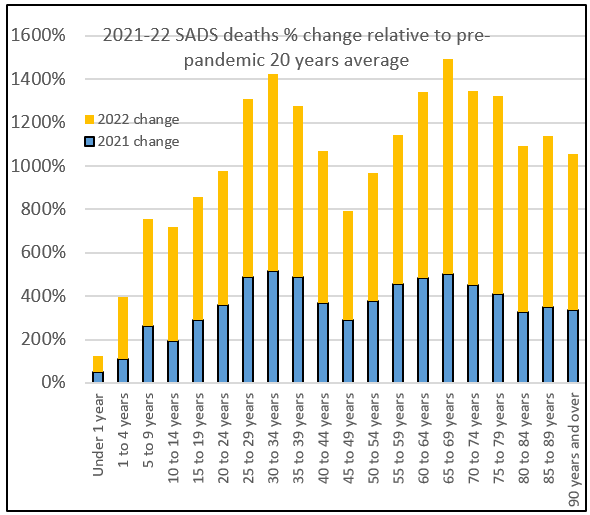
To put it in pandemic perspective, in 2020 we had all Ministries jumping up and down about 16,000 Covid deaths, where the average age of a deceased was 84 - two years over the Canadian life expectancy. In 2022, we have 20,000 Covid deaths, plus 30,000 extra deaths, of which almost half are SIDS/SADS distributed across all age groups and hitting hard the most productive adult population (more than 10-fold increase of SADS deaths in 30-34 age group compared to pre-pandemic 20 years’ average!). And there is not only no mainstream media coverage of this scandal, but also no meaningful description of those SIDS/SADS deaths metrics in the government report.
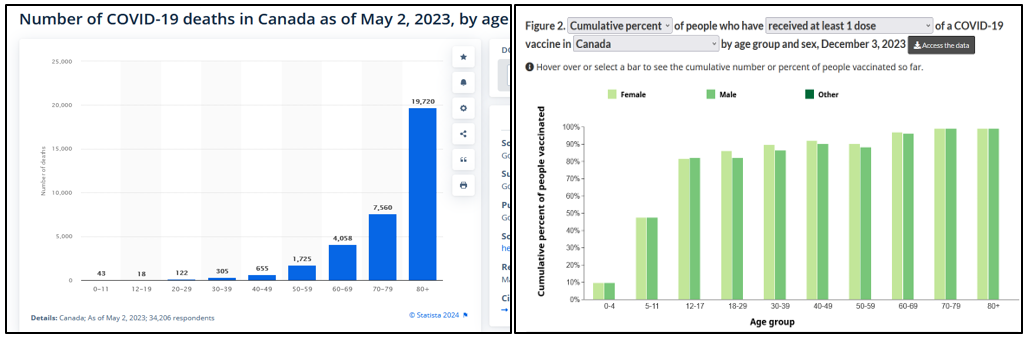
Here’s the age profile of the so-called “Covid deaths” placed next to the age stratified vaccine distribution. Which one is closer to the SADS profile above should leave no doubt what causal agent needs to be investigated first if we were to choose between just those two prospects.
And yes, in 2020 SADS and other deaths increased significantly, when there were no vaccines at play and many other factors that need to be accounted for and researched. The point here is to show that the horrible mortality picture in Canada and across the “developed world” cries out for a thorough investigation, in which vaccination must not be hand-waived into irrelevance because of the correlation with excess deaths alone. The mechanisms that have very real potential of turning such a correlation into causation, however, do exist in chilling abundance. But that, along with discussing alternative candidates like opioid overdose, MAiD, etc. is left for Part II.
Thanks for this excellent analysis
Good work, Klim!